
Kaloncon.com - Providing BI Resources for Home Health Advocacy
Exploring the Impact of the CMS Proposed Rule for Home Health

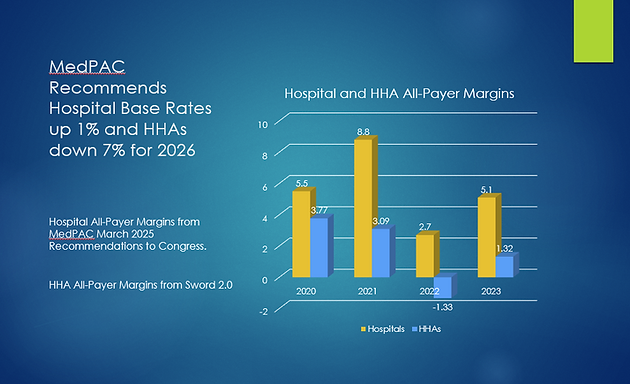
Read Project Sword 2.0 and Compare my View of the Financial Condition of HHAs Compared to MedPAC's
Project Sword 2.0
Updated 8/13/25
Read my report that analyzes home health cost report data. See the actual financial position of HHAs using all-payer margins developed using the Sisense business intelligence tool. See how it compares to the data presented by MedPAC and CMS using Medicare FFS data alone.
Look at the data provided or use it to do your own analysis.


Kaloncon.com provides research on HHA profitability using the same cost report data MedPAC and CMS use to justify their payment cuts
I apply the Sisense business intelligence tool to home health cost report data to develop new insights on the home health industry not shared by CMS or MedPAC.
These insights could be the key to influencing CMS to alter their own behavior using the same data they use in the proposed rule to support their assumptions.
MedPAC Assumptions Regarding HHA Profitability
See how the same cost report data used by MedPAC provides a very different picture of HHA profits than what was provided in their March 2025 payment recommendations to congress.
The Impact of Medicare Advantage on HHA Profits
The cost reports now break down revenue, census and visits by financial class. See how we can use this new data to measure the impact of MA on HHA profitability.
The Data Published by MedPAC and CMS Market Saturation Data Show a Steep Decline in Home Health Utilization
MedPAC's own data and CMS Market Saturation Data show a decline in HHA utilization as HHAs close their doors and reduce their service areas. Despite this, both organizations propose the largest cuts ever to HHA payments.
Do Your Own Analysis
Use the data provided with Sword 2.0 to do your own analysis of home health cost report data using your favorite spreadsheet application.
Using Cost Report Data and Sisense Business Intelligence
In the blog, I apply the Sisense business intelligence tool to home health cost report data to develop new insights on the HHA industry not shared by CMS.
These insights could be the key to influencing CMS to alter their own perspectives using the same data they use in the final rule to support their assumptions.

MedPAC's Faulty Data Leads to Faulty Conclusions
In Sword 2.0, See how errors in MedPAC data on the number of HHAs, marginal profits, and All-Payer margins have endangered HHAs.
See How Hospital Payments Under MA Affect MA Reimbursment for HHAs
The Medical Loss Ratio allows MA Plans to keep 20% of Medicare FFS spending. After subsidizing Medicare payments to hospitals with these funds, HHAs get only the scraps left over.
The HHA Coverage Map by County in Sword 2.0 Shows Large Deserts of HHA Coverage
MedPAC claims that 98% of zip codes have at least 2 HHAs. The actual HHA count shows that vast areas of the country have no access to care in the home.
See How Once Viable Post-Acute HHAs are Being Replaced by Dubious Growth in LA County
LA County is the only county in the USA with significant growth. This growth is not real and these agencies represent a threat to real HHAs and the Medicare Program
